Background
An organization owns a fleet of 20 aircraft. The top 5 most problematic repairable LRUs in terms of failures are U01, U02, U03, U04, and U05. When any of these items fails on an aircraft, its mission is aborted.
Given that each aircraft is scheduled to operate for 100 hours over the next year, the organization aims to anticipate the number of failures to facilitate their logistic support planning.
The total inventory of U01 units is 25, with 20 installed in aircraft and 5 maintained as standby spares in the warehouse.
Below is a snapshot of the failure data collected for 9 units of U01 (serial numbers U01-01 to U01-09; data for the remaining 16 units is not displayed).
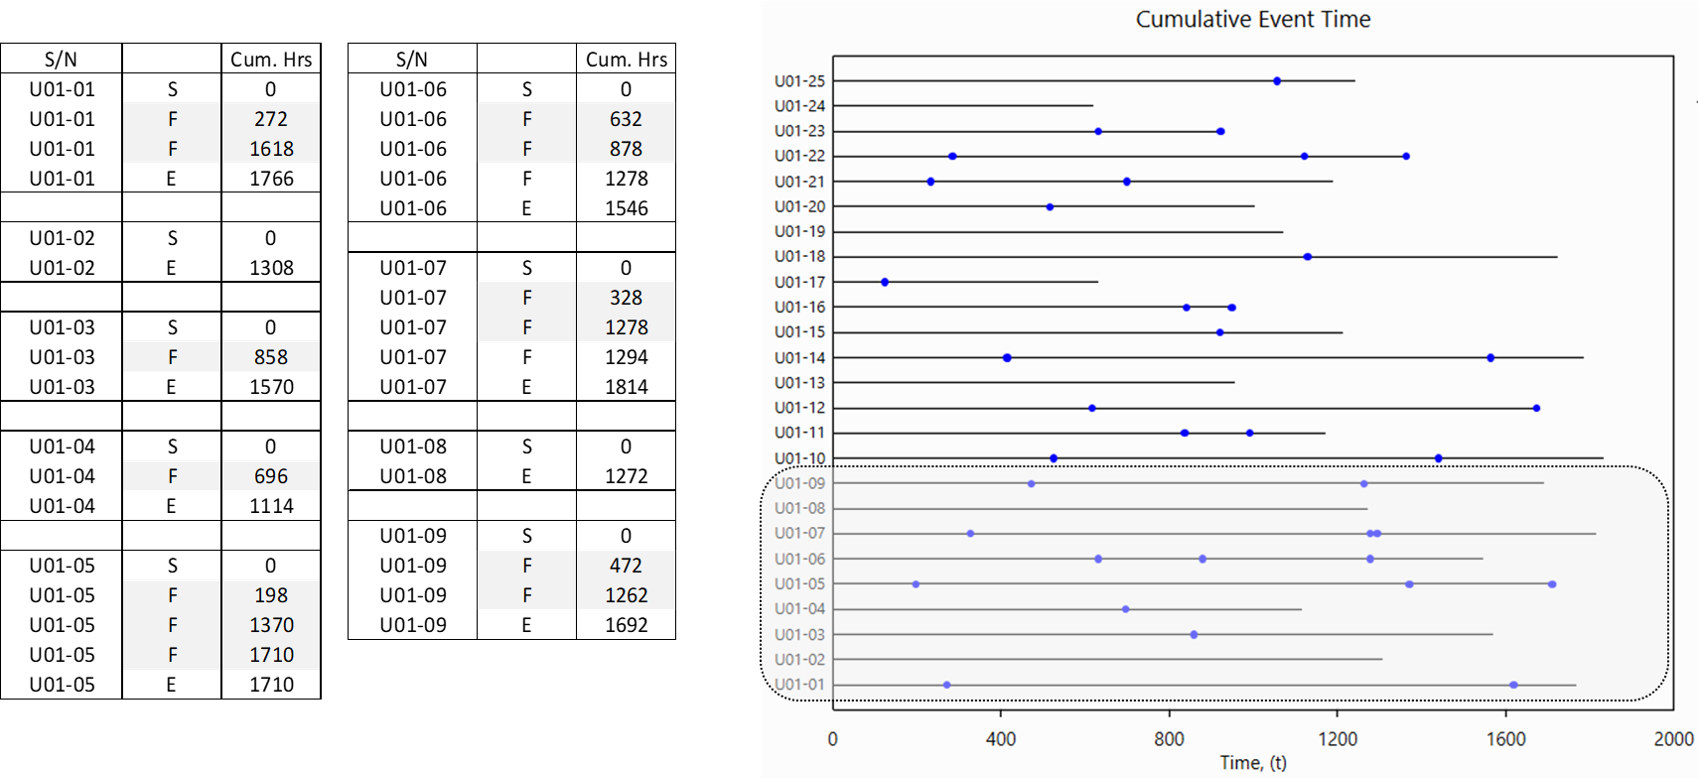
For example, unit U01-01 has accumulated 1,766 hours of operating time and experienced 2 failures.
Failure data for U02, U03, U04, and U05 are available in the same format (not shown here).
Using this historical data, we will forecast failures for these units over the next 100 hours of operation to enable management to prepare the annual repair budget.
The Approach
Note that Life-Data Analysis is not applicable for repairable items (unless the items can be considered as good as new after each repair).
Recurring Data Analysis (NHPP with Power Law model) was applied to each unit (U01 to U05). Below is a snapshot of the analysis for U01.

Forecasting Repairable Spare Requirements Using Recurring Data Analysis
Beta (β) and Lambda (λ) are the parameters of the mean cumulative function as shown below.
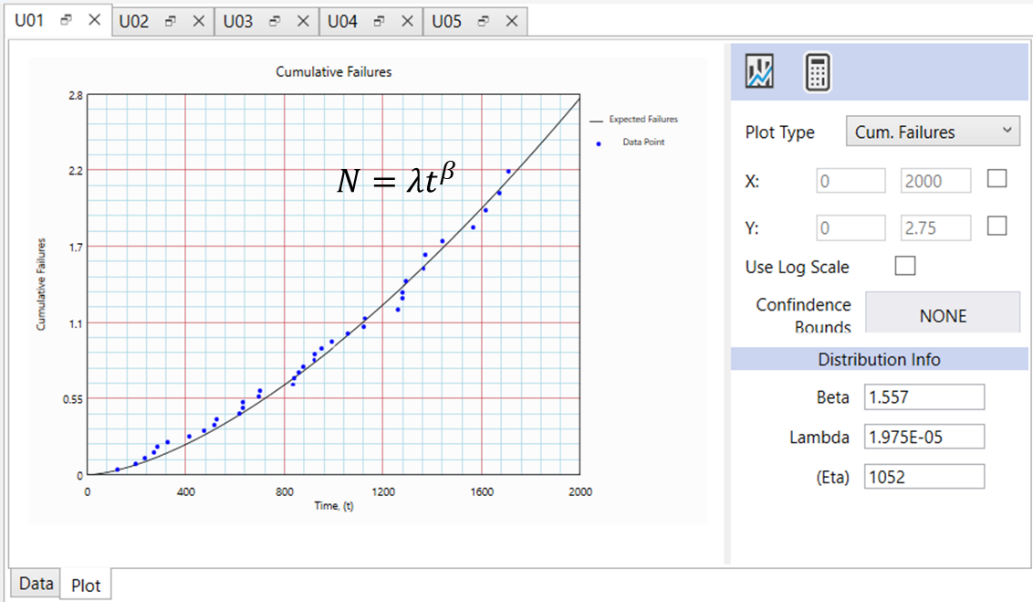
This function is used to project the number of failures in the future.
Query the model for Number of Failures at 1,766 and 1,866 hours respectively.
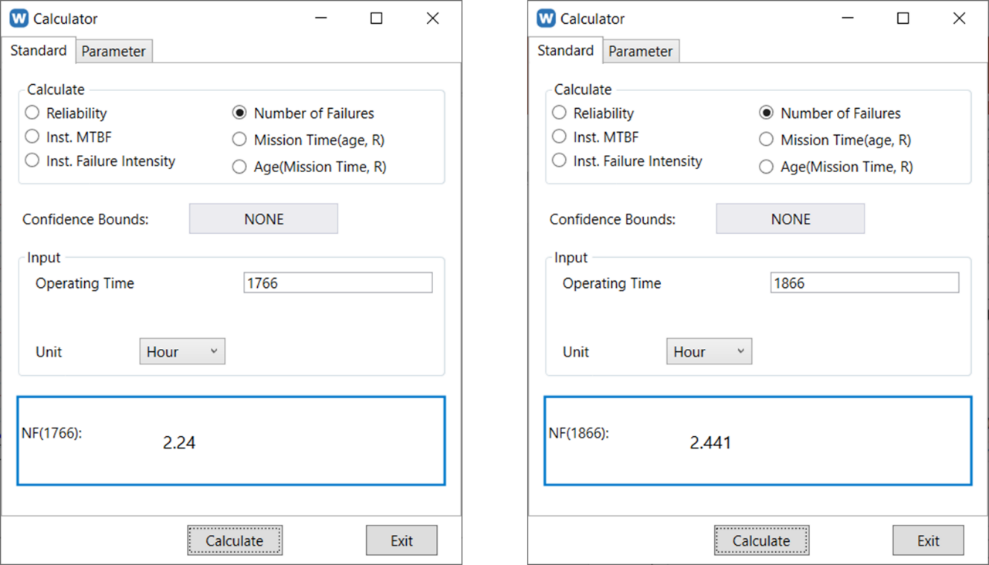
Expected number of failures for U01-01 for the next year (100 operating hours):
= 2.441 - 2.24 = 0.201
Similarly, the expected number of failures for the other U01 units were calculated.
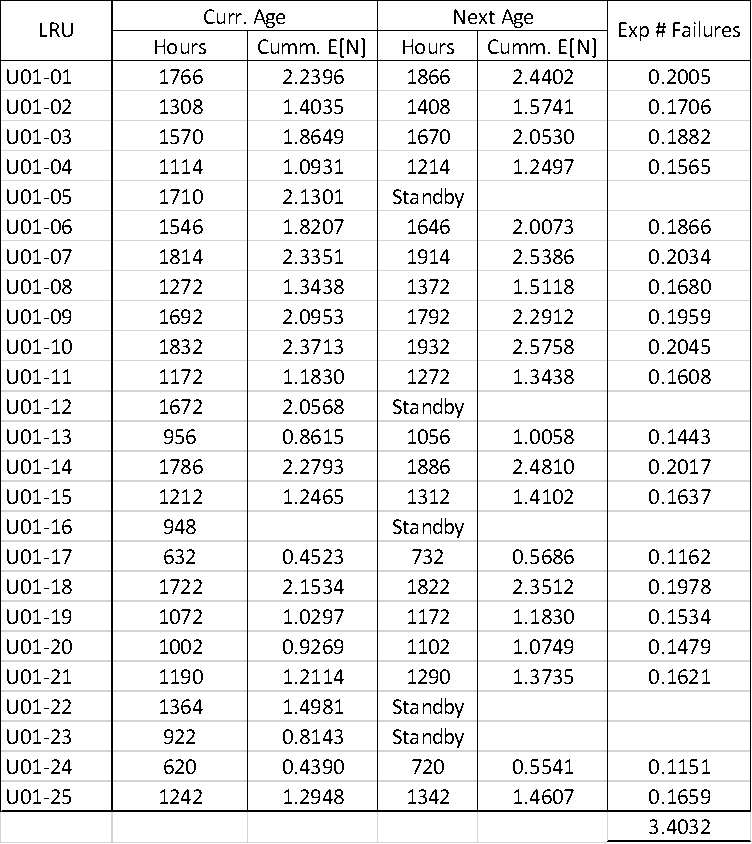
This analysis was repeated for the other LRUs (raw data not shown here).
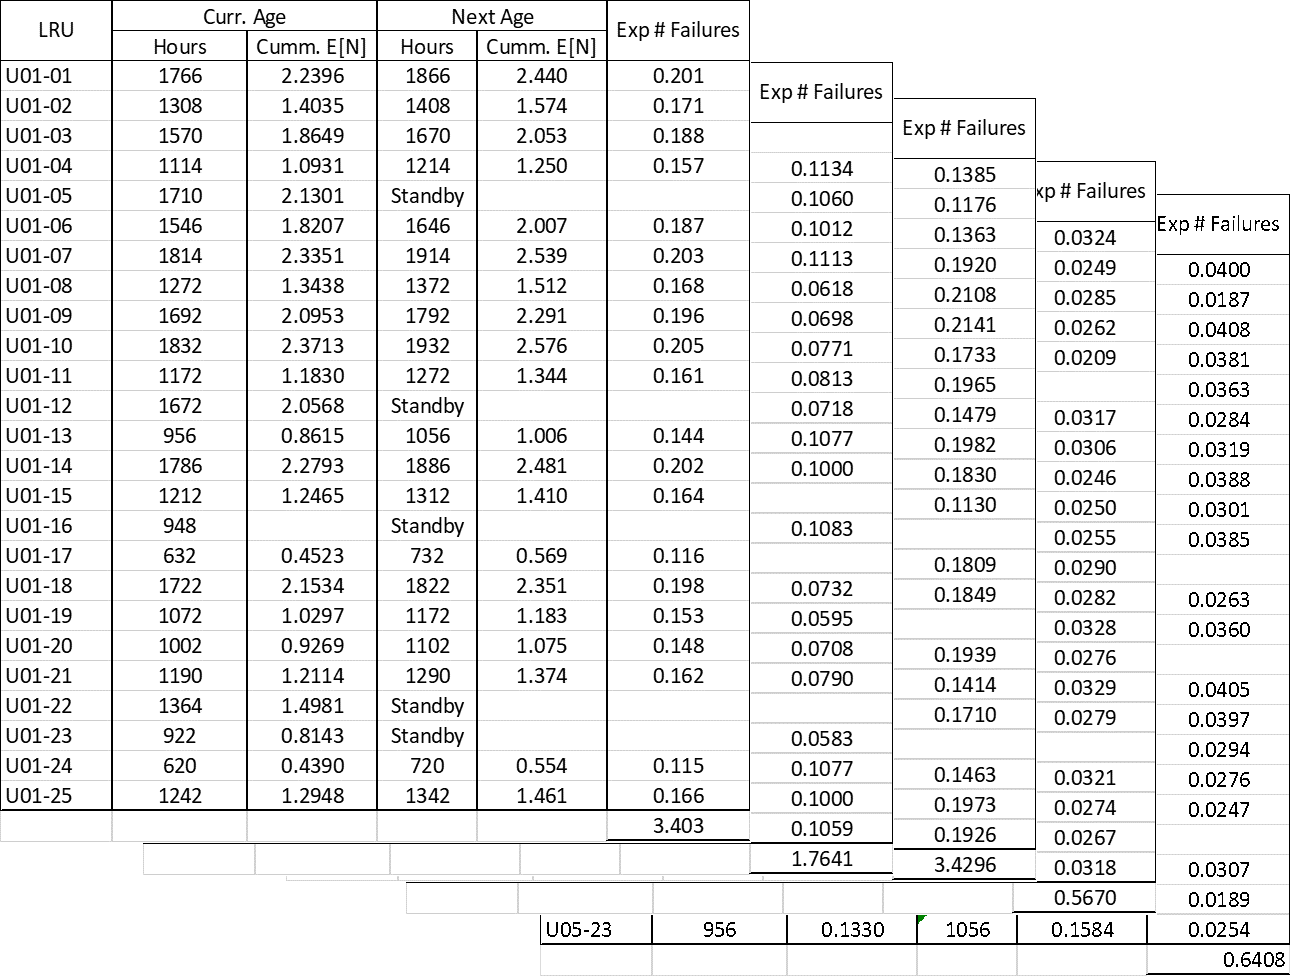
The expected numbers of failures for the following year for this fleet are shown below.

Conclusion
- Analysts should distinguish between repairable and non-repairable items. Recurring data analysis is applicable for repairable items.
- Recurring data analysis can be used to project future failures for repairable spare part (rotable spare parts).
Comments
- Recurring Data Analysis can also evaluate failure intensity trends to deduce the reliability of each unit given its current age.
- Given that all items exhibit increasing failure intensity trends, we can also determine the economic life of each unit.
Related articles
Recurring Data Analysis Assumptions and Their Implications
Applying Recurring Data Analysis: A Use Case Example
-End-