Introduction
Multiple failure modes represent the various ways in which a unit may fail. Consider a population of units susceptible to failure modes A, B, and C. The observed failure time corresponds to the minimum of the individual potential failure times for each mode. The unit’s reliability model is constructed by treating A, B, and C as components connected in series.
This presentation outlines the procedure for analyzing products with multiple failure modes and compares it with an analysis where failure mode information is disregarded. The product’s overall reliability model is derived by combining the reliability of each failure mode in series.
Example
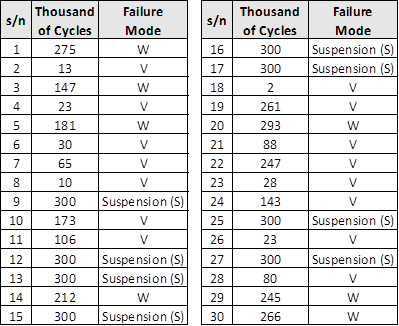
The dataset used in this presentation is sourced from Meeker and Escobar’s Statistical Methods for Reliability Data. It involves an electric component subject to two failure modes: wear-out (W) and voltage surge (V).
Multiple failure modes are the different ways in which a particular unit might fail.
The Approach
If the focus is solely on wear-out failures (W), units that fail due to voltage surges (V) are treated as suspensions (S). Conversely, if analyzing voltage surge failures (V), units failing from wear-out (W) are considered suspensions (S).
Two additional columns are included in the following table to indicate the failure/suspension status for each failure mode of interest.

All three datasets are fitted with a Weibull distribution, and the results are overlaid on the same graph.

- The blue and green lines represent the models for voltage surge (V) and wear-out (W) failure modes, respectively.
- The black line corresponds to the combined failure mode model (ignoring failure modes).
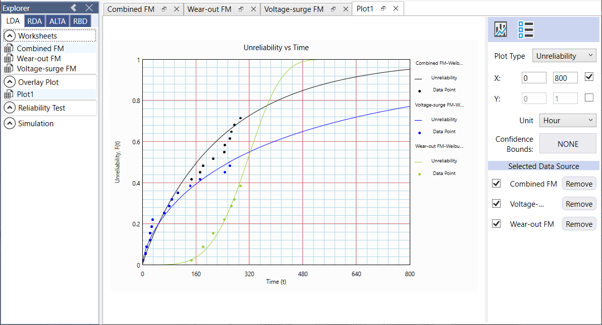
The item’s unreliability at t = 5 (thousand cycles), derived from the combined failure mode line, is:
Q(5) = 0.027 (see Figure 1), ⇒ R(5) = 0.973
Since the item has two failure modes (V and W), we also assess each mode separately:
For the voltage surge failure mode (V), Q(5) = 0.048 ⇒ R(5) = 0.952.
For a system with two components (or failure modes) in series, the system reliability at any time *t* is always lower than that of any individual component. Therefore, analyzing failure modes (or components) separately is recommended whenever possible.
System Equation
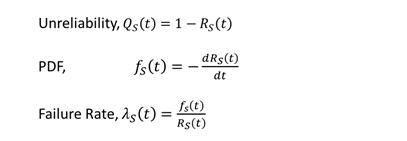
After analyzing failure modes individually, the system-level unreliability Qₛ(t) can be determined as follows:
From Rₛ(t) = Rₘ(t) × Rᵥ(t),
Qₛ(t) = 1 – [(1 – Qₘ(t)) × (1 – Qᵥ(t))]
The Weibull-Toolbox RBD module enables the reconstruction of the item’s reliability model by treating failure modes V and W as components in series.

Based on the system equation Rₛ(t) = Rₘ(t) × Rᵥ(t), other reliability metrics can be derived.

Readers may compare the item’s unreliability curve in Figure 4 with that in Figure 2.
Standard reliability metrics for the system can be obtained using the built-in Calculator.

Conclusion
his example demonstrates the analysis of non-repairable items with multiple failure modes. The item’s reliability is reconstructed using a series-system approach, offering deeper insights into its reliability behavior.
However, such an analysis is feasible only if failure mode diagnostics are performed on every failed component.
- End -