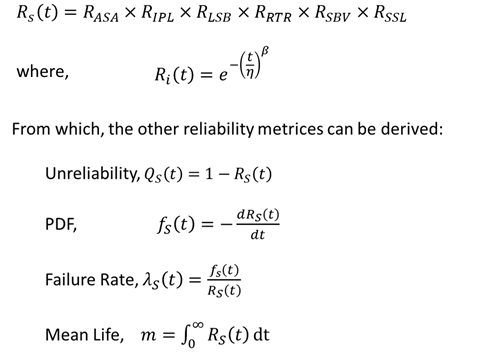
The Scenario
A manufacturer has reliability program in place. They have a very good understanding on the failure modes (in terms of its failure rate behavior) of a particular product. The manufacturer wants to know what is the cost benefit, specifically warranty cost reduction, of a reliability improvement program.
The pump has the following failure modes and corresponding failure distributions.

Time unit is in Day.
The manufacture provides a 200-days on-site warranty.
Labor cost to replace pump on-site = $1,100
The cost of manufacturing and selling of the pump is $600
The selling price of the pump is $1,000
The cost of a pump fails within warranty time: cost of pump ($600) + Labor cost ($1,100) = $1700
Taking warranty cost into account, what is the expected profit of selling a pump?
The Approach
A Reliability Block Diagram (RBD) is created using Weibull Toolbox.

System Reliability:
From Weibull Toolbox, query system unreliability at 200 days.
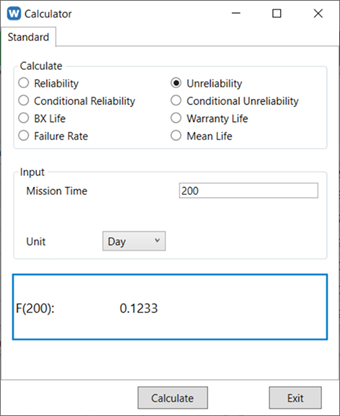
The probability of failure at warranty time of 200 days is 0.1233
Hence, for every pump sold, the warranty cost = 0.1233 x 1,700 = $209.61
The expected profit of each pump = (1,000 – 600) – 209.61 = $190.39
Reliability Importance metric
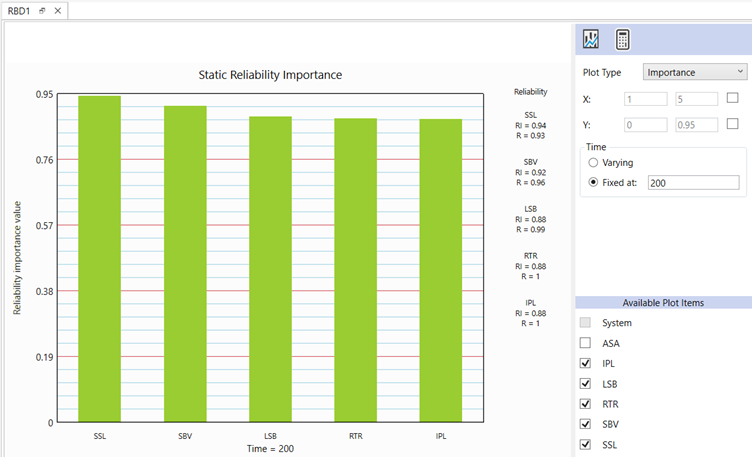
Obtain the Static Reliability Importance plot at t = 200 days.
An item with the highest Reliability Importance, (a value between 0 and 1) indicates that the change in system reliability is most sensitive to the change in reliability of this item. Therefore, to get the maximum effect of your improvement effort, you would target the item with highest Reliability Importance when possible.

To maximize reliability improvement efforts, target the item with the highest Reliability Importance whenever possible.
It shows that Shaft Seal (SSL) has the highest Reliability Importance and its reliability at 200 days is 0.93.
The R&D department verify that reliability of SSL at 200 days can be improved to 0.993 (Weibull with beta=3, eta=800 days), but it cost an additional $50 to make the pump.
Recommandation
The manufacturer seeks your recommendation on whether to proceed with the product reliability improvement, based on which option delivers greater profitability.
Update the reliability information of SSL in the RBD, and recompute system reliability at 200 days.

System unreliability at 200 days reduces to 0.06992
Therefore, the projected warranty cost for each pump = 0.06992 x 1,750 = $122.36
The expected profit of each pump = (1,000 – 650) – 122.36 = $227.64
This translates to a significant 19.6% profit increase, rising from $190.39 to $227.64 per unit. The demonstrated financial benefit clearly justifies implementing the improvement program.
Conclusion
This example uses the Reliability Importance metric to identify the weakest component in a product. The decision on whether to improve it is based on a cost-benefit analysis that incorporates various cost components and reliability data.
What if the analysis reveals no profit increase—or worse, a decline? Such scenarios underscore that reliability improvements aren’t just about immediate profitability. In competitive markets, the focus shifts to sustainability: Can you maintain profitability while meeting customer expectations for reliability?
Quantitative reliability analysis empowers manufacturers to foresee warranty costs’ impact on their bottom line, turning data into strategic advantage. Whether prioritizing profit margins or market survival, these tools ensure decisions are grounded in clarity, not guesswork.
-End-