This example analyzes the production downtime impact due to spare restock-triggering policy and lead-time constraints.
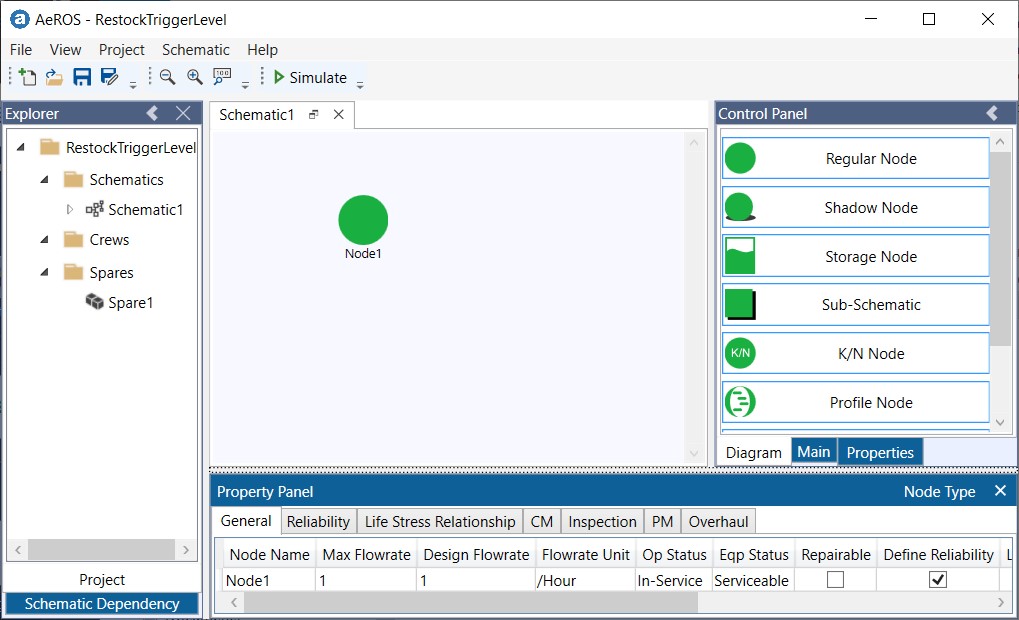
Figure 1 shows a network containing only one equipment node (Node1). We configure the spare resource for Node1 with its current policy as a basis for sensitivity analysis.
Key assumptions:
- Restock lead-time for spares: 60 days
- Consumption rate follows exponential distribution (mean = 30 days)
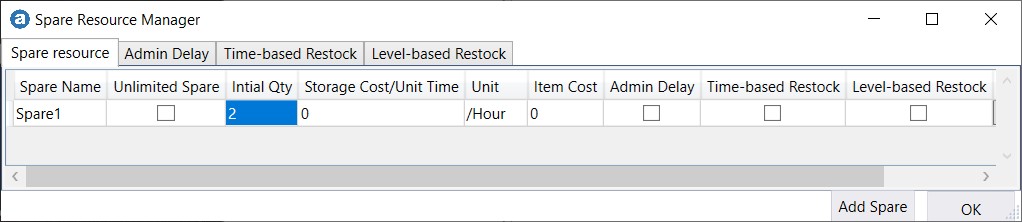
- Restock order triggered when inventory reaches 2 units
- Production stops if spare is unavailable during failure
A "Spare Resource" is created (Project → Manage Spare Resource → Add Spare). The Initial Quantity is set to 2 (default name: "Spare1").
The schematic consists of one "Regular Node" (Node1) with:
- Reliability: Exponential with MTBF = 30 days
- Corrective Maintenance: Fixed with Time-to-Event = 0 hour
Spare resource "Spare1" is assigned to the CM Crew as shown Figure 3 below:

Using simulation approach to determine optimum restock policy.
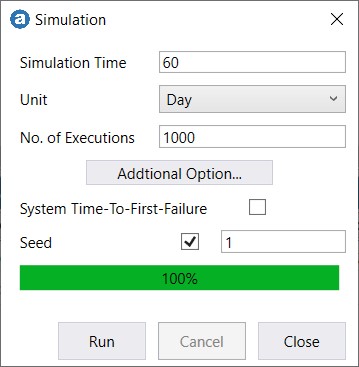
We want to determine, for a 60-day duration lead time with initial quantity N = 2, what is the average duration where Node1 is down due to spare unavailability.
Run a 60-day simulation with 1,000 executions:
From "Control Panel", click "Show Results" button, then select the "Spare" tab in the Simulation Results dialog:
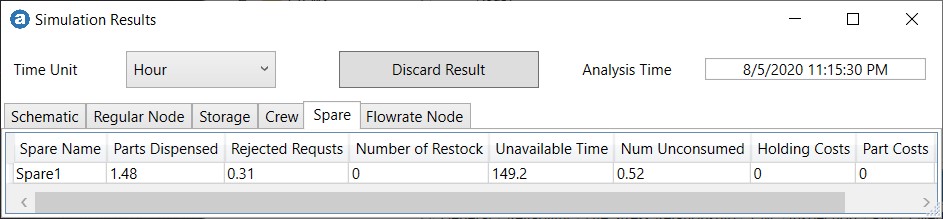
The average downtime due to spare unavailability is 149 hours (under "Unavailable Time" column). This means that triggering re-orders at 2 spare units carries an average risk of 149 downtime hours.
By running simulations with different trigger levels, we can estimate the corresponding downtimes:
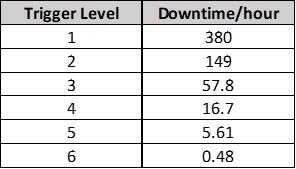
This analysis enables managers to determine optimal order quantities (given that the restock lead time 60-day ) while understanding the associated downtime risks.
-End-