Background
A company warehouse maintains and supplies spares for large-scale, round-the-clock production. This example demonstrates how to analyze the overall cost impact of different spare part replenishment strategies, considering production rate, spare cost, lead time, and item failure rate behavior.
Key assumptions for this item:
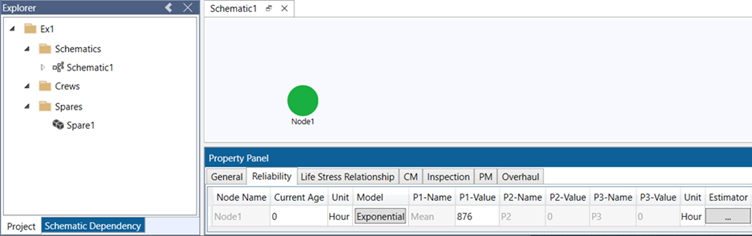
- Demand rate: 10 units/year (Exponential distribution)
- Penalty cost for unavailability (production loss): $50,000/day
- Unit cost: $50,000
- Holding cost: $20/day
- Restock logistic delay: 30 days
The current policy triggers a restock order when inventory reaches 6 units, replenishing to maintain 10 units (denoted as [U=10/T=6]). The logistics manager wants to evaluate whether reducing both the restock upper limit and trigger level could optimize costs while considering production risks.
The Approach
We'll use simulation to estimate overall costs (spare usage, logistics, and production loss) under the current policy, then perform sensitivity analysis by varying the policy settings.
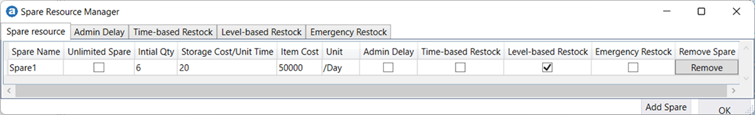
A "Spare Resource" (Spare1) with "Level-based Restock" policy is created, including "Item Cost" and "Storage Cost" parameters:
A Spare Optimization Approach That Considers Its Cost Impact.
The "Level-based Restock" policy specifies that when stock reaches 6 units, it triggers an order to replenish to 10 units, with a 30-day lead time:

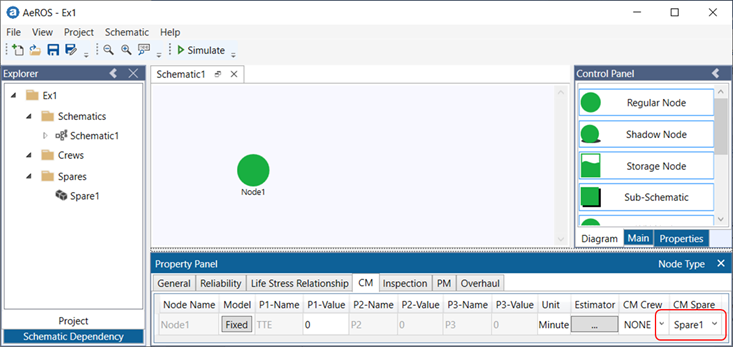
The spare resource Spare1 is assigned to the Corrective Maintenance (CM) task.
In AeROS, if spare resource is not defined for a maintenance task (Corrective, Preventive and Overhaul), the simulation assumes that the spares required for maintenance are always available without delay, and it is free.
If a spare resource is defined for a maintenance task, then the task duration will be constrained by the spare availability and its associated administrative delay. The simulation will compute the spare consumption statistics.
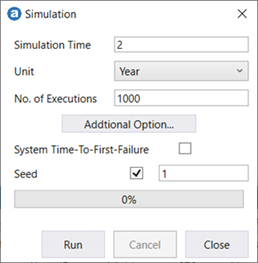
We run a 2-year simulation with 1000 executions to evaluate the current policy:
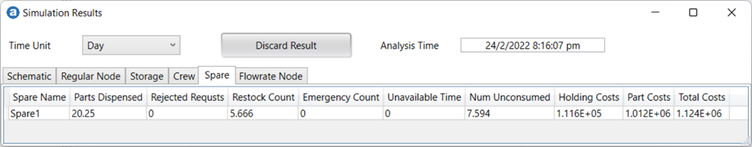
Results show 0 downtime hours under the current policy, meaning no production loss or penalty costs:

Spare resource statistics show a total cost of $1,124,000 over 2 years with 5.7 restock events:
Sensitivity analysis evaluates different [U/T] combinations and their cost impacts:
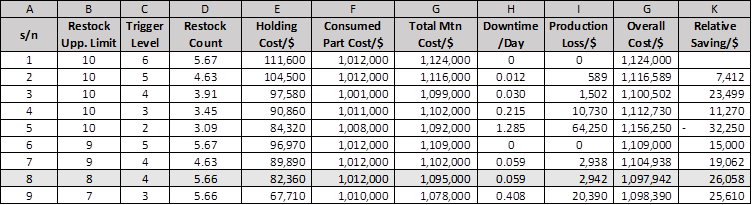
Column D to H are obtained from simulation results.
The Production Loss (Column I) : Downtime x Penalty Cost ().
The Overall Costs is the sum of Total Mtn Costs (Column G) and Production Loss (Column I).
Key finding:
Reducing both Restock Upper Limit and Trigger level from [10/6] to [9/5] provides a saving of $26,058 (over 2 years).
Conclusion
This approach provides a systematic way to optimize inventory policy while considering production risk. The analysis balances holding costs against potential production losses to identify the most cost-effective replenishment strategy.
-End-