Scenario
An offshore gas platform produces 500 mmscfd (Million standard cubic feet per day). The following shows the critical sub-systems, their reliabilities, downtime distributions, and operating configurations.
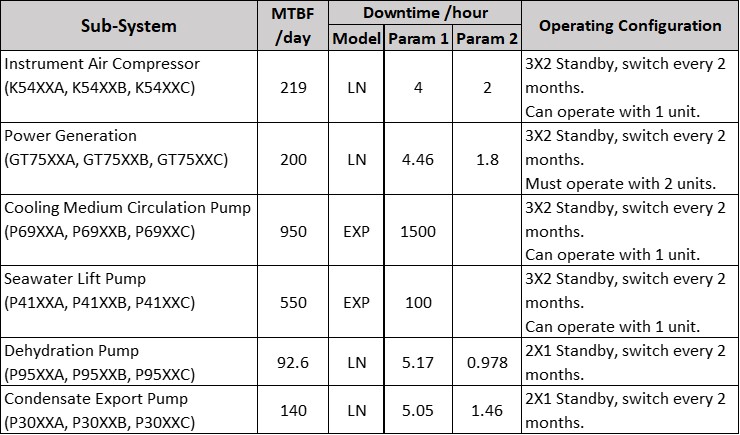
The objective is to rank sub-system performance based on their contribution to production loss.
The Approach
A Reliability Digital Twin is constructed to determine the Availability and Production Effectiveness of the system.
A schematic for each sub-system is created. Following is the schematic of Instrument Air:
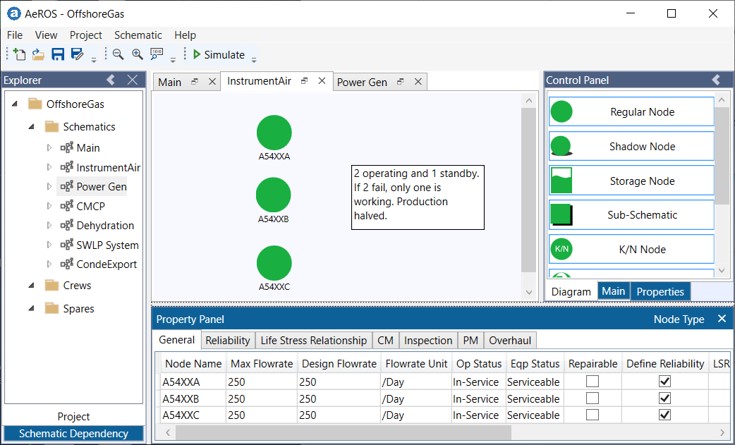
A Reliability Digital Twin is constructed to determine the Production Effectiveness of the system.
The Flowrate and Design Flowrate are set to 250 /day (such that the total flowrate is 500 /day). Reliability for each compressor is set to Exponential with MTBF = 250 days, and Corrective Maintenance (CM) downtime to Lognormal (Log-Mean = 4, Log-Std = 2, unit in hour).
The Redundancy Manager is used to define the standby configuration for Instrument Air Compressors: 3x2 standby, system can operate with only one compressor. The following describes how to setup such requirements.
1. From main menu, Schematic → Manage Redundancy. Click on Add Redundancy button, Redundant Resource Manager dialog appears.
2. The participating nodes are A5400A, A5400B and A5400C. Select these nodes from Available Nodes list to Selected Nodes list.
3. Add 6 states (click on Add State button 6 times) in the State Table. Check Periodic checkbox to indicate that switching will occur according the state Duration. Set Duration Unit to Month. Edit the State Table as shown.
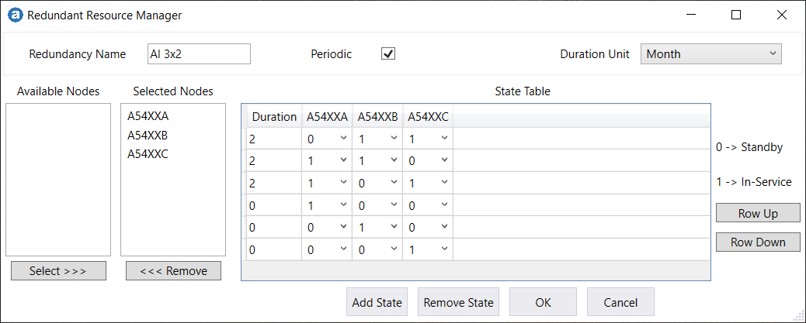
The Instrument Air compressors will operate according to the state defined in state table. Each state will last 2 months, and then switch to the next non-zero-duration state, cyclically. If an operating compressor fails, switching occurs immediately.
This table contains states with 0-durations. These are "undesirable" states (but valid state). The system operates in these states provided that the serviceability of participating compressors does not meet the "desirable" (non-zero-duration state) states requirements.
Rename Redundancy Name to Redundancy-IA, and OK the dialog. OK the Redundancy Manager.
Based on the above procedures, create schematics for Power Generation, Cooling Media Circulation Pump (CMCP), Seawater Lift Pump, Dehydration Pump and Condensate Pump sub-system.
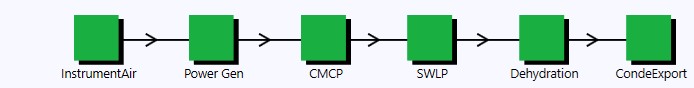
Add a new schematic called Main. For each sub-schematic (Instrument Air, Power Generation...), create a sub-schematic node. Connect these nodes in series as shown.
Run a 3-years simulation with 1000 executions to estimate the Availability and Effectiveness of the system.

The projected output is 529,883 mmscf, and the effectiveness is 0.968. If the assets were perfectly reliable (i.e., all assets never fail), the output would equal 365 × 3 × 500 = 547,500 mmscf.
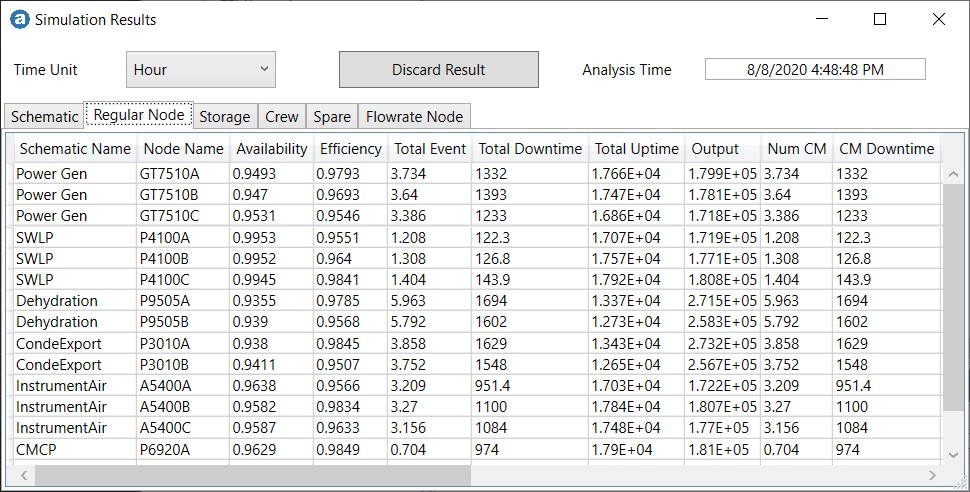
To explore the simulation results, from Control Panel → Main tab, click on Show Results button.
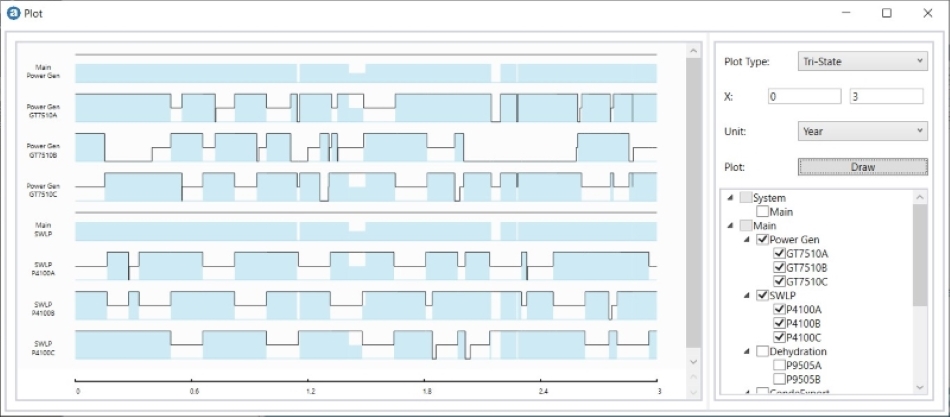
You can also explore the last simulated operating profile. Control Panel → Main tab, click on Show Plot button → Tri-State Plot.
Estimate the loss contributed by each sub-system
The loss contributed by a standby sub-system cannot be derived from the downtime of the sub-schematic that contains it. When the sub-schematic is up, it may not be producing at the design flowrate.
However, we can obtain the effectiveness of Instrument Air standby sub-system, for example, through simulation at Instrument Air schematic level.

The effectiveness of Instrument Air standby sub-system is 0.997.
The effectiveness of a standby sub-system can also be deduced from the up-times of individual items.
Take Instrument Air sub-system as an example. If the compressors within the standby system do not fail, the equivalent operating time by single compressor would have been 2 × 3 years = 6 years.
The up-times for each compressor are available from the simulation results:
A5400A: 17,030 hours
A5400B: 17,840 hours
A5400C: 17,480 hours
The total equivalent operating time by single compressor is 52,350 hours (or 5.976 years).
Hence, the effectiveness of Instrument Air sub-system is (5.976/6 × 100%), or 0.996.
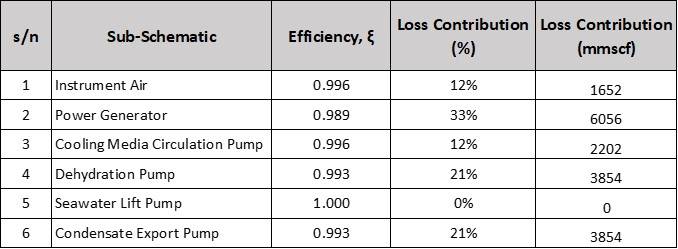
Similarly, obtain the effectiveness of the other sub-systems.
The Loss Contribution of sub-system n can be estimated using the following equation.
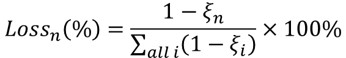
For example, loss contribution by Instrument Air:

Given the total losses is 17,617 mmscf, the losses due to individual sub-system can also be calculated.
Conclusion
Ranking of a standby sub-system performance based on production loss contribution in a network can be complicated due to redundancy. This example shows how to rank standby sub-system performance in terms of production loss.
Note: In this example, all equipment within the standby sub-system has the same flowrate. If this is not the case, the analysis method becomes more complex and is beyond this presentation's scope.
-End-