Introduction
An organization owns a fleet of 10 vessels, each containing a vital non-repairable item. This example demonstrates how to forecast spare inventory requirements using historical reliability data through Life Data Analysis.
Analysis objective
Determine the projected number of failures over the next 2 years (assuming 100 operating hours per vessel per year) to avoid operational downtime due to spare shortages.
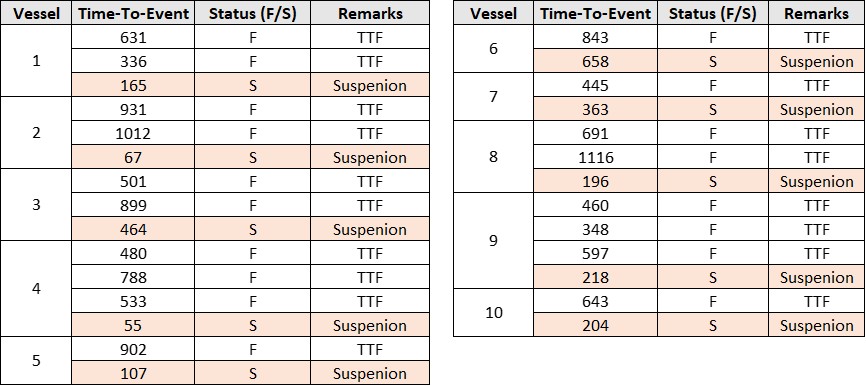
The following repair history is available for the fleet:

For example, Vessel 1 shows two Time-To-Failure (TTF) events at 631 hours and 336 hours (967 - 631), plus one item still operating after 165 hours of operation (suspension time).
The complete failure dataset, including all TTF events and suspensions, is shown below:
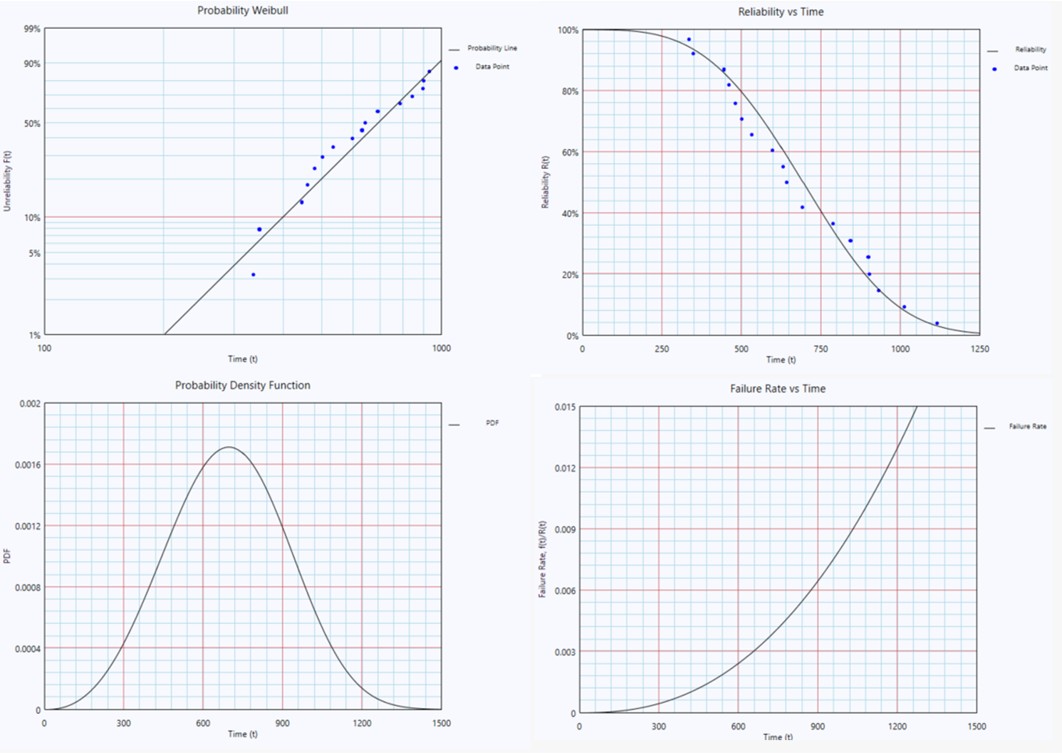
The dataset was fitted to a Weibull Distribution with the following parameters:

The analysis indicates a Weibull Distribution with shape parameter β = 3.42 and characteristic life η = 771 hours best describes the item's failure behavior. The following plots visualize the distribution characteristics:
Forecasting of Spare Requirements for a Fleet of Vessels using Life Data Analysis
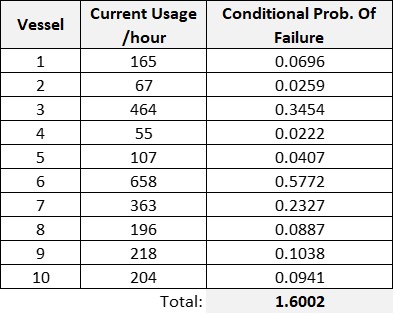
Given the failure distribution and current age of each item, we can project failures for a 200-hour operation period. For Vessel 7 (current age = 363 hours), we calculate the Conditional Probability of Failure for an additional 200-hour operation period:

This shows a 23.3% probability of failure for Vessel 7 during the next 363 hours of operation.
Extending this calculation to all vessels provides the complete failure probability profile:
Conclusion
The expected total number of failures across all vessels during 200 hours of operation is 1.6 units.
This method works well for short mission times where we don't expect multiple failures per vessel. For longer mission times (e.g., 1000 hours), a simulation approach would be more appropriate.
-End-