A company warehouse maintains and supplies spares for a large scale, round the clock productions. Taking production rate, cost of spare, lead-time and item failure rate behavior into considerations, this example shows how to analyze the overall cost impact due to different spare part replenishment strategies for a particular item.
Followings are the assumptions regarding this item.
- The demand rate is 10 units/year with Exponential distribution.
- The penalty cost if item is not available (due to production loss) is $50,000/day.
- Unit cost is $50,000.
- Holding cost is $20/day.
- Restock logistic delay is 30 days.
In the current policy, when the stock level reaches 6 units, a restock order is initiated such that the inventory level is maintain at 10 units. I.e., when the stock level is 6 units, the CMMS will initial a restock order with a quantity of 4 units.
The logistic manager wishes to know, by reducing both the restock upper limit (currently 10 units), and the restock trigger level, whether it is possible to reduce the inventory taking penalty cost into consideration.
The following section uses simulation to estimate the overall costs (costs associated to spare usage and logistic, and production loss) with current spare policy. I.e., restock upper limit =10, and restock trigger level = 6. We use this format, [U=10/ T=6] as a short-hand.
We than perform sensitivity analysis by changing the spare policy settings [U / T], and estimate the corresponding overall costs.
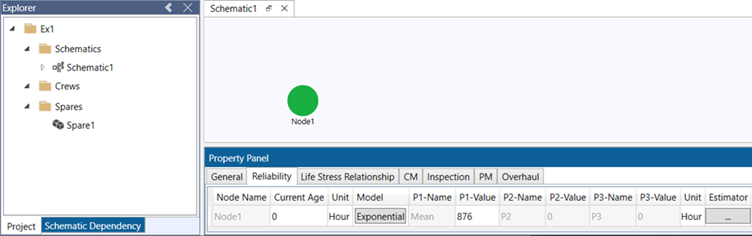
We start by constructing a node with current policy settings. The node represents the item that consumes the spare.
A node with constant failure rate (exponential) of 876 hours (demand rate is 10 units/year) is created. The CM downtime is set to 0 hour, so that only unavailability of spare is accountable for the item downtime.
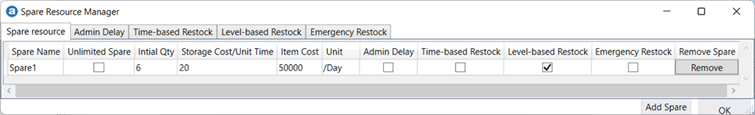
A spare resource (Spare1) with Level-based Restock policy is created. The settings include Item Cost and Storage Cost as shown below.
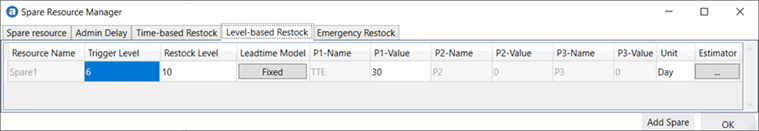
Select Level-based Restock tab as shown below. The Level-based Restock policy specifies that when the stock level reaches 6, it will trigger a restock order to replenish Restock Level to 10 units. The Leadtime is set to 30 days.
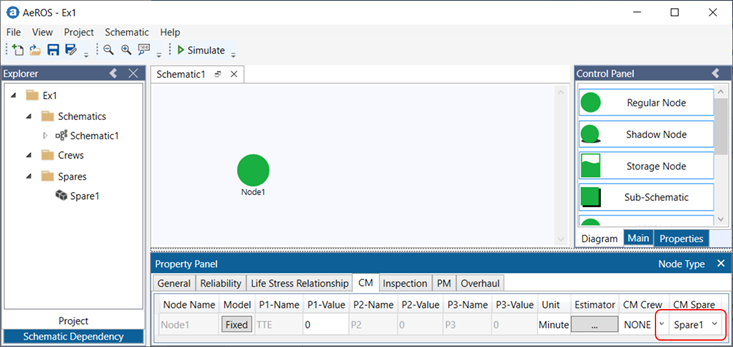
The spare resource Spare1 is assigned to Corrective Maintenance (CM) task.
In AeROS, if spare resource is not defined for a maintenance task (Corrective, Preventive and Overhaul), the simulation assumes that the spares required for maintenance are always available without delay, and it is free.
If a spare resource is defined for a maintenance task, then the task duration will be constrained by the spare availability and its associated administrative delay. The simulation will compute the spare consumption statistics.
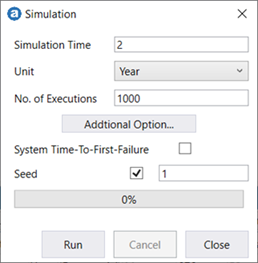
Run a 2-year simulation with 1000 executions.
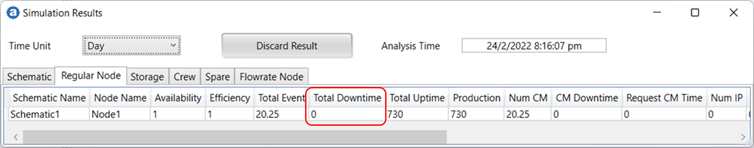
The Simulation Results dialog (Control Panel->Show Results) provides the simulation result statistics. Under the Regular Node tab, the downtime is 0 hours. It means this policy does not cause any production loss (hence no Penalty cost incurred).
The statistics for the spare resource are shown under Spare tab.
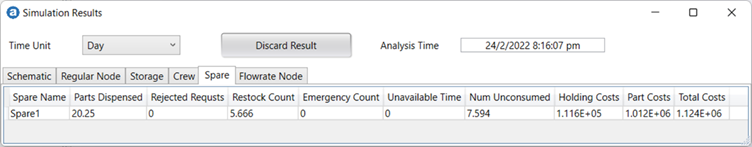
The cost (over 2 years) due to spare usage is $1,124,000, and restock occurs 5.7 times.
Using the above model, we can now perform a sensitivity analysis by varying the restock upper limit (currently 10 units), and the restock trigger level. We use this format, [U=10/T=6] as a short-hand.
Different [U/T] values are set for the restock policy (column B and C), and the corresponding costs are estimated through simulations.
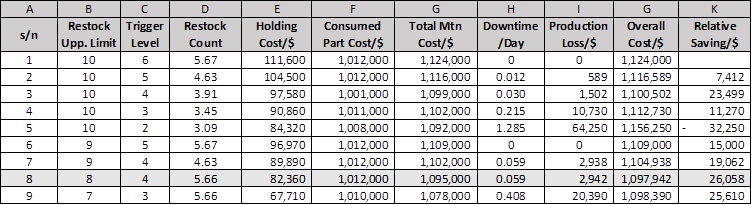
Column D to H are obtained from simulation results.
The Production Loss (Column I) : Downtime x Penalty Cost ($50,000).
The Overall Costs is the sum of Total Mtn Costs (Column G) and Production Loss (Column I).
Reducing both Restock Upper Limit and Trigger level from [10/6] to [9/5] provides a saving of $26,058 (over 2 years).
Summary
The restock trigger level should not be too low, as it may cause production loss. The restock upper limit has cost impact on holding cost, but too low a level may result in frequent restock counts.
This approach provides a way to optimize the inventory policy, taking its impact on production risk into consideration.
-End-